September 7, 2026 · By Karl Sundström
China Builds 70% of Robotics. You Can Buy 0% of It.
Our verified map holds 1,093 tradeable companies across 11 markets and zero mainland Chinese listings, while the purity tiers hold 26. The gap between access and purity, explained with numbers.
#robotics #investing #data
A week ago we published a verified map of the robotics supply chain: 1,093 companies across 11 national markets, every row checked against a live quote on 2026-08-30. This is the country cut, and it answers a question that story skipped:
Where can retail money actually go, country by country?
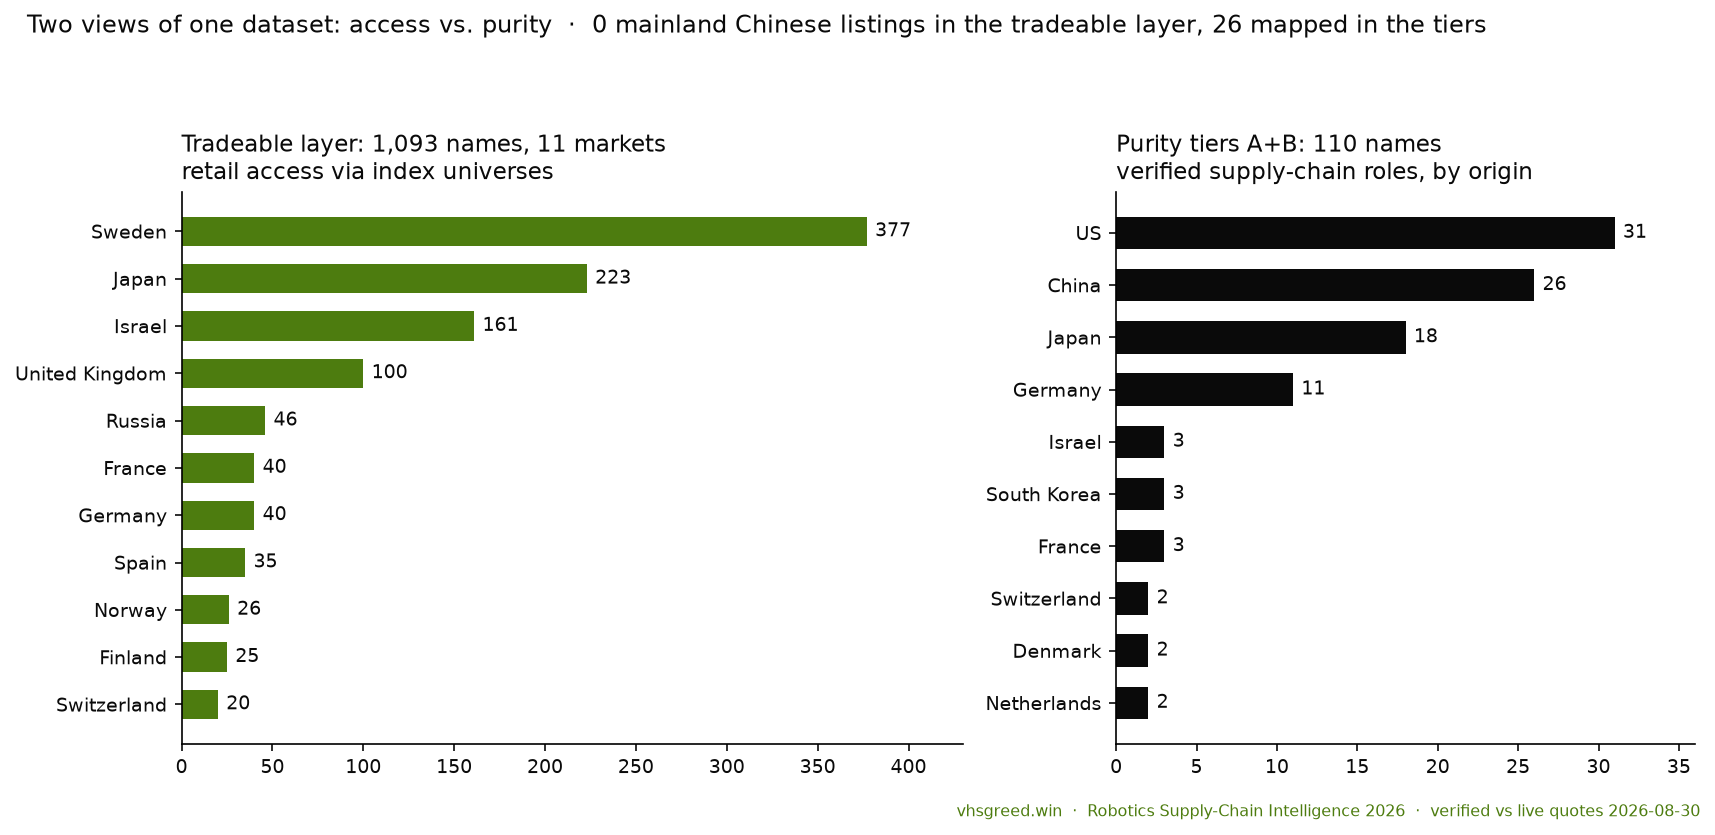
Left: tradeable listings by country. Right: verified core+emerging supply-chain names by origin. The gap is the point.
The distribution
- Sweden: 377
- Japan: 223
- Israel: 161
- United Kingdom: 100
- Russia: 46
- France: 40
- Germany: 40
- Spain: 35
- Norway: 26
- Finland: 25
- Switzerland: 20
(US: handled separately below. Russia: appendix below.)
Why Sweden tops the list (and why that is honest)
Sweden is first because the methodology says so, not because Sweden leads robotics. We swept the full Nasdaq Stockholm universe by segment (Large 138 / Mid 133 / Small 106), the deepest single-market pass in the set. A Swedish investor can open one broker app and hold all 377.
The tradeable layer measures retail access, not industrial output. It also measures adjacency: many of those 377 are automation, sensor, and component suppliers rather than pure robotics. Call it what it is. Worth stating plainly: not one of the 377 makes the dataset’s purity tiers. Sweden is access, not chain. That is why the next section is the one that matters.
The purity tiers: who is actually in the chain
The tradeable layer is the wide net. The dataset also has two narrow tiers, hand-classified by role in the chain. Combined, 110 companies:
- Tier A, the verified core: 64 companies in critical positions (OEMs, actuators, reducers, sensors, compute, batteries). By origin: China 21, US 14, Japan 13, Germany 3, South Korea 3, Taiwan 2, rest single digits.
- Tier B, emerging: 46 names. US 17, Germany 8, China 5, Japan 5, Israel 2. (Combined: US 31, China 26, Japan 18, Germany 11, Israel 3.)
The purity tiers include Chinese names that are not in the tradeable layer. They are mapped, verified, and flagged with the access route that does exist: Unitree (688836, Shanghai, restricted to Western retail) carries its Hyperliquid perp route, BYD carries its OTC proxy (BYDDY), NIO, XPeng, and Li Auto carry their NYSE and NASDAQ ADRs, and the private names carry explicit “not investable” flags.
Read those China numbers against the tradeable layer’s zero. The chain runs through China; the brokerage account does not. That is the whole gap in two rows.
Second-best exposure: ADRs, OTC, ETFs
Direct listing is not the only access route, and we should not pretend otherwise. The core tier already includes ADR/OTC routes where they exist: BYD trades OTC as BYDDY, and the dataset carries it. XPeng and peers have US-listed ADRs. Unitree itself listed on the Shanghai STAR Market (688836), which no Western retail broker hands you directly.
ETFs are the honest third layer: the exposure map carries nine fund routes at instrument level (KOID, BOTZ, IRBO, ROBO, ROBT, plus the battery and rare-earth funds), each described against what it holds thematically. That is fund-level mapping, not holdings-level; the ETF holder trusts the fund’s prospectus for row-level truth. If you want Chinese-chain exposure from a Western account today, an ETF holding the names you cannot buy is the realistic route. Low purity, real access.
No US sweep, and we say so
The 10,391-ticker US layer is the SEC EDGAR universe, not a robotics-filtered count. Sweeping it the way we swept Stockholm was out of scope for v3; claiming a US number would have been a guess. What we do have: 14 US names in the core tier and 17 in emerging. The US mega-cap list (TSLA, NVDA) every chatbot recites is the least supply-chain-specific part of the map.
Where Israel actually sits
Israel’s 161 is the number most likely to mislead, so here is the honest version. The 161 are the full TA-35 and TA-125 index universes: an access map, not a robotics filter. Three Israeli names carry verified supply-chain roles: Innoviz (LiDAR), Vayyar (radar), and Mentee Robotics (humanoid OEM). The rest sit in a defense-and-optics cluster that borders the chain without being it.
That makes Israel an adjacency play with retail access, not a supply-chain play. The diversifier case rests on the cluster, not on 159 core names that do not exist.
The China-shaped hole, priced
Unitree context, since the August peak needs a timestamp: it opened at a $66B peak on 2026-08-19, closed day one at 845 CNY, and trades at 536 CNY as of 2026-09-07 (latest verified at time of writing). That is 37% below the first close and roughly half the 1,100 intraday peak. The correction does not change the point. It sharpens it: real price discovery for the sector’s hottest asset happened somewhere Western retail could not go.
Why Japan is the value-capture layer
Three reasons, not one assertion:
- Physical moat. Precision reducers (Harmonic Drive’s strain-wave gears, Nabtesco’s cycloidal drives) are machined to tolerances that took decades to dial in. They are 40-55% of a humanoid robot’s bill of materials and hard to qualify out.
- Incumbent lock-in. The major humanoid and industrial OEM programs source from these two names; switching suppliers means re-qualifying the joint, which means re-testing the robot.
- Patent and process IP. The know-how is in the manufacturing line as much as the design file, which is why decades of attempts to clone these components have not produced a cheaper equivalent at spec.
Japan (223 tradeable names) is where that layer lives.
Appendix: Russia
Russia (46 rows) stays in the dataset with explicit UNVERIFIED flags because Yahoo no longer carries MOEX quotes. They are excluded from the counts above and from any tradeable interpretation. Keeping them visible is a data statement: here is what exists, here is what we could not verify. Nothing was silently dropped.
The takeaway
Where robots get built and where robots get bought are different maps. If you invest through a Western retail account: your direct exposure to the Chinese core is zero, your realistic China route is an ETF holding names you cannot buy, your real supply-chain exposure runs through Japan, and your most underrated diversifier is Israel, not the US mega-cap list.
The complete verified dataset behind this analysis: 20 files (v4), both purity tiers, the full tradeable layer, the exposure map with org depth, registry org profiles for 55 organizations, $7: Robotics Supply-Chain Intelligence 2026
Built by vhsgreed, a self-funded AI research shop in Stockholm. We publish the method, the bugs, and the numbers. No paid promotion, no affiliate links.