September 13, 2026 · By Karl Sundström
We Reconstructed Nvidia's Supplier Network From Public Disclosures
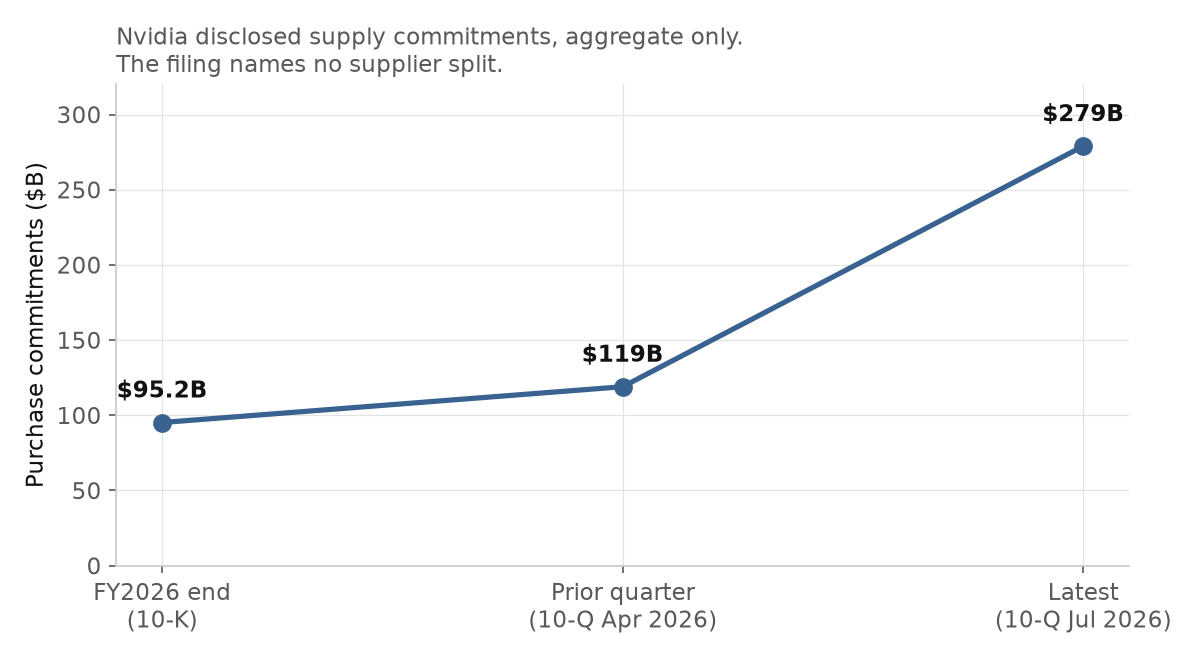
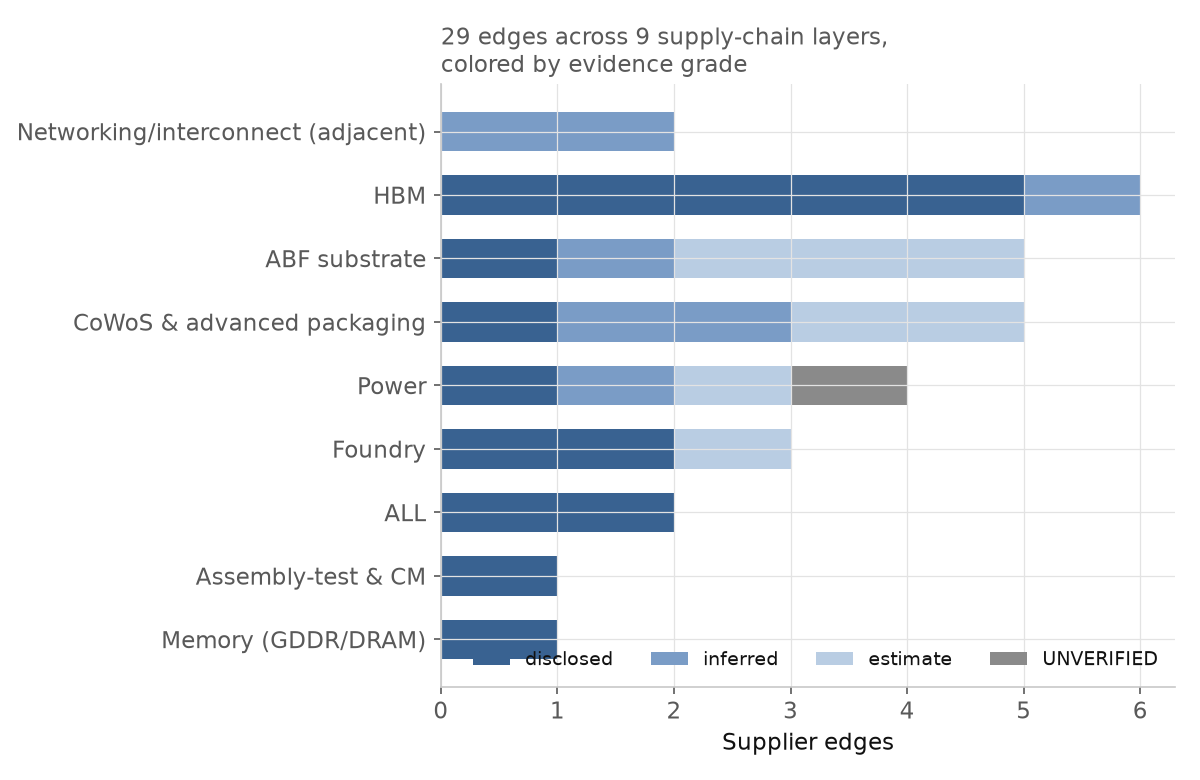
Nvidia discloses $279B in supply commitments and no supplier split. We reconstructed 29 supplier edges across 9 supply-chain layers from public filings, with an evidence-grade flag on every row.
#nvidia #supply-chain #semiconductors #data
Abstract (TL;DR)
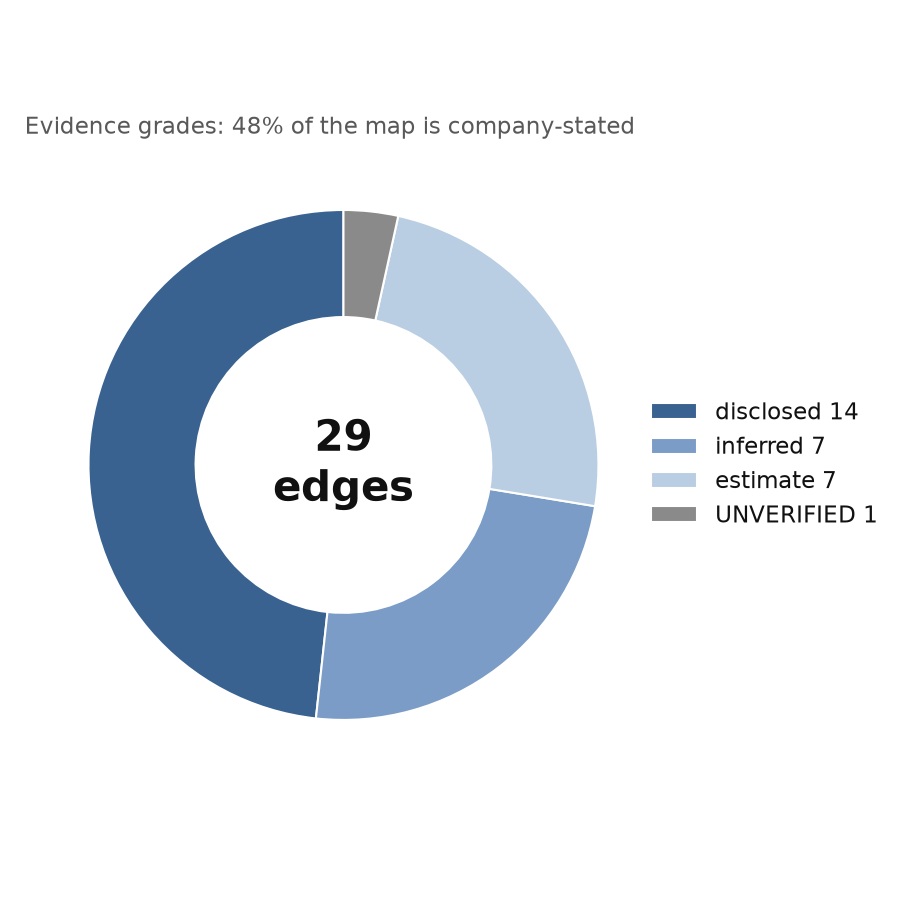
Nvidia’s quarterly filing discloses $279 billion in supply commitments and names no supplier split. We test how far public disclosures alone can reproduce the supplier-mapping work usually treated as proprietary intelligence. The result: 29 supplier relationships across 9 supply-chain layers (HBM memory, advanced packaging, foundry, substrate, assembly, power), where every edge carries a verbatim quote, a dated source URL, and one of four evidence flags: disclosed, inferred, estimate, or UNVERIFIED. Fourteen edges are company-stated; one is explicitly unverified. The dataset rebuilds byte-identically and re-anchors quarterly from each new filing.
Commercial note. We sell the dataset this paper describes. The vendor is vhsgreed (Karl Sundström, sole proprietor); the dataset is $5 at Gumroad. This is a for-profit work, and that motive is disclosed up front rather than discovered in the last section. The method, data, and limitations above stand or fall independently of it: every claim is sourced, and the flags grade evidence, not salesmanship.
1. Background
1.1 The research problem
The conventional approach treats supplier mapping as proprietary intelligence. Institutional research (SemiAnalysis at $70/month, TrendForce, TechInsights) serves firms, not individuals; DigiTimes is paywalled. We test a simpler question: how much of that work can be reproduced from documents anyone can fetch, and how confident can a reader afford to be in the result?
The anchor fact: Nvidia’s 10-Q for the period ending 2026-07-26 (filed 2026-08-26) reports purchase commitments of $279B, up from $119B the prior quarter. The filing is consistent with substantial capacity reservations across Nvidia’s manufacturing chain, although it does not disclose the allocation. That allocation is what we reconstruct.
1.2 Why supplier-side reconstruction works
Nvidia does not name its suppliers in filings; its suppliers’ own disclosure obligations name Nvidia for it. Three mechanisms:
- Customer-concentration disclosures. Public-company reporting requirements can cause suppliers to disclose material customer concentrations, sometimes without naming the customer. TSMC’s 20-F reports “Customer A” at 19% of 2025 net revenue, up from 12% the prior year.
- Newsroom announcements. SK hynix announced a partnership with Nvidia on 2026-07-25 with a stated value of $500B (as reported in the company’s own newsroom, USD, multi-year scope). This is the loudest disclosed edge in the dataset and, at face value, an extraordinary one; we discuss it in Section 4.
- Capex with stated purpose. Ibiden’s ¥500B substrate expansion and Kinsus’s NT$23.5B equipment investment are disclosed without naming buyers. The tie to AI-server demand is stated; the tie to Nvidia specifically comes from reporting context, and our flags say so.
2. Method
2.1 Data collection
Sources were constrained to keyless, non-paywalled documents: SEC EDGAR (10-Q/10-K/20-F for NVDA, TSMC, MU, AVGO, MRVL, AMKR, ASE), DART and company newsrooms for SK hynix, and PR pages. Paywalled sources (DigiTimes, TrendForce reports) were excluded entirely; their free public summaries were used only as context. Tool spend: under $0.05 (search API calls).
2.2 Edge construction
An edge is a tuple (supplier, layer, direction) plus evidence. The 9 layers are supply-chain categories (HBM memory, CoWoS & advanced packaging, ABF substrate, foundry, power, and so on), not sequential hops from Nvidia; a tier-2 layer (suppliers of the suppliers) is documented separately and not counted in the core 29. Each edge carries either a verbatim quote from a named document or an explicit statement of why the tie is inferred.
2.3 The evidence flag
Every edge receives exactly one flag:
| Flag | Meaning | Count |
|---|---|---|
disclosed | A company stated the relationship in a primary document | 14 |
inferred | Strongly implied by public disclosure | 7 |
estimate | Reasoned from public data with stated assumptions | 7 |
UNVERIFIED | Credible claim, no primary source captured; kept and labeled | 1 |
The flag exists because the failure mode of every “supplier list” on the internet is silent blending of confirmed facts with SEO slop. Our design decision: an unverified edge stays in the dataset, visibly marked, rather than being quietly dropped or quietly promoted. Note what the flags do and do not cover: the 29 counts are supplier edges. Nvidia’s $279B aggregate commitment is a separately disclosed financial fact, not one of the 14 disclosed edges.
2.4 Reproducibility
The build is a deterministic script: same inputs, byte-identical outputs, verified twice, with SHA256SUMS in the package. A refresh hook re-runs the extraction each quarter against the newest filings; the late-November 10-Q is the first scheduled test of the pipeline’s currency.
3. Results
3.1 Sample rows
Five of the 29 edges, verbatim from the dataset:
| Supplier | Layer | Evidence | Grade | Why |
|---|---|---|---|---|
| SK hynix | HBM | Company newsroom, 2026-07-25 | disclosed | Nvidia named in the company’s own PR |
| TSMC | Foundry | 20-F customer concentration | inferred | Customer-A arithmetic (Section 3.2) |
| Ibiden | ABF substrate | Capex disclosure + reporting context | inferred | AI expansion stated; buyer tie from context |
| Monolithic Power | Power | Public data + stated assumptions | estimate | Allocation model, contested by a named research shop |
| (unnamed ABF edge) | ABF substrate | Secondary reporting only | UNVERIFIED | Primary source not captured before ship |
3.2 One row, verbatim
This is a complete row from the dataset, exactly as it appears in the CSV and JSON (one of the three disclosed HBM edges):
{
  "supplier": "SK hynix",
  "tier": "HBM",
  "direction": "supplier->NVIDIA HBM revenue",
  "evidence_quote": "NVIDIA and SK hynix establish long-term partnership to secure and co-develop next-generation AI memory, including HBM.",
  "source_url": "https://news.skhynix.com/en/skhynix-nvidia-partnership-2026/",
  "source_date": "2026-07-25",
  "flag": "disclosed",
  "tickers": "000660.KS;HXSCL"
}
Every row looks like this: the claim, the verbatim sentence that supports it, a link you can click and check yourself, the date it was published, and the grade we assigned. The 28 other rows vary in evidence strength, which is what the flags track.
3.2 The Customer-A inference, shown in full
The most sensitive single inference deserves its arithmetic:
- TSMC’s 20-F: largest customer = 19% of 2025 net revenue (was 12% in 2024, 25% in 2023); second customer = 17% (was 12%, 11%).
- The customer that grew to match Nvidia’s 2025 AI capacity ramp is, on scale and timing, consistent with Nvidia rather than Apple, TSMC’s historical largest customer.
- We considered Apple as the alternative: Apple remains a TSMC customer at enormous scale, and “Customer A” is not guaranteed to be the same company year over year. The 2025 growth pattern is what makes Nvidia the stronger candidate, not a certainty.
- We do not identify Customer A as Nvidia in the source data. The identification is our analysis, which is exactly why the edge is graded
inferredrather thandisclosed.
3.3 What the map shows
- Disclosed: SK hynix’s partnership PR; HBM4 mass shipments; concentration bands at Micron (one customer 10% of FY2025), Broadcom (32%), Amkor (29.8%), Marvell (Customer A, 16%).
- Inferred: TSMC Customer A (Section 3.2); Ibiden and Kinsus AI-driven capex; Delta Electronics’ 800V DC power participation at GTC.
- Estimate: Monolithic Power’s power-stage content, where our estimate collides with a named research shop’s contrary claim (Edgewater Research’s allocation-risk call), which we log rather than resolve.
- UNVERIFIED (1): the ABF substrate edge where credible secondary reporting exists but no primary document was captured before ship.
The most consequential number in the dataset is not any single edge but the aggregate commitment curve: $95.2B at FY-end, $119B the prior quarter, $279B at the July 10-Q. The 29 edges are a labeled, evidence-graded view of the network that curve plausibly runs through. They are not a dollar allocation of it; no source discloses that split, and we do not invent one.
4. Limitations
- Aggregate ≠ split. Nvidia discloses the total; the per-supplier decomposition is our reconstruction, and its confidence is exactly as good as the flags say.
- Unnamed customers. “Customer A” disclosures are arithmetic inferences, not statements. The alternatives are considered in Section 3.2.
- One-hop bias. Tier-2 suppliers (ASML; Hanmi Semiconductor’s $28.7M HBM4 bonder order from SK hynix; the equipment vendors) sit one disclosure further from Nvidia, so most tier-2 edges are inferred or unverified. The tier-2 layer is documented but not part of the 29-edge core.
- English-source bias. Japanese and Taiwanese IR documents (Ibiden, Shinko, Unimicron) were not pulled in full this cycle; those edges are correspondingly weaker.
- One extraordinary claim. The $500B SK hynix figure is disclosed in the company’s own newsroom and we carry it as stated. Its scope (multi-year, presumably product value plus investment) is not broken down in the public document. If that number is later restated or rescoped, the affected edges get re-flagged in the next refresh.
5. Discussion
Two findings surprised us. First, the flag distribution is itself information: 48% of the map is company-stated (14 of 29), a higher disclosed share than we expected at the start. The disclosure-gap problem is real but narrower than the market’s pricing implies. Second, the map degrades honestly. Where evidence thins (power delivery, substrate), the flags drop from disclosed to estimate to unverified in a way that matches the underlying document availability, which is what a falsifiable dataset should do.
The quarterly refresh matters more than it sounds. A static supplier list is stale on arrival; a dataset that re-anchors on every 10-Q is an instrument. The $279B figure gets its first quarterly test in late November 2026, and each refresh will re-grade edges whose evidence changed. A skeptical reader should be able to take any single edge, follow its evidence trail, and decide whether they agree with our grade. That is the actual product.
6. Commercial appendix
The dataset ships as NVIDIA Supplier Map 2026, $5. Concretely, $5 buys: the 29-edge CSV with verbatim evidence and source URLs, a JSON edition, a data dictionary, the build report with SHA-256 checksums, and the quarterly refresh script. A 14-day refund window applies. If the paper alone answered your question, the dataset is optional; it exists for readers who want the row-level evidence rather than our summary of it.
A machine-readable edition is exposed at vhsgreed.win/ai/products/ and via MCP for agent consumption.
Karl Sundström runs vhsgreed, a one-person data research shop in Stockholm. Every claim here is sourced; where it could not be, the dataset says so.